
Compare a scene with and without the widget, then reduce unnecessary page work or its frame rate. Test shutdown and refresh options against the widget’s actual event behaviour.
Compare the page, browser frame rate and hidden-source behaviour without losing alerts unexpectedly.
In this guide
Before you start
- A duplicate scene collection and a provider test event you can safely trigger.
- OBS Stats plus the operating system’s process view, with the usual game load reproducible.
Measure the source’s effect, not its screen area
A small browser box can load scripts, animation, video and network content. Its size in the composition does not tell you how much work the underlying page performs. Begin with a short recording of your normal scene and note CPU use, rendering misses and the widget’s behaviour.
Then compare a scene without that browser page under similar game load. If the difference is negligible, investigate other sources instead of optimizing the first visible animation. If the scene improves, inspect that page and its settings before lowering the resolution of the whole show.
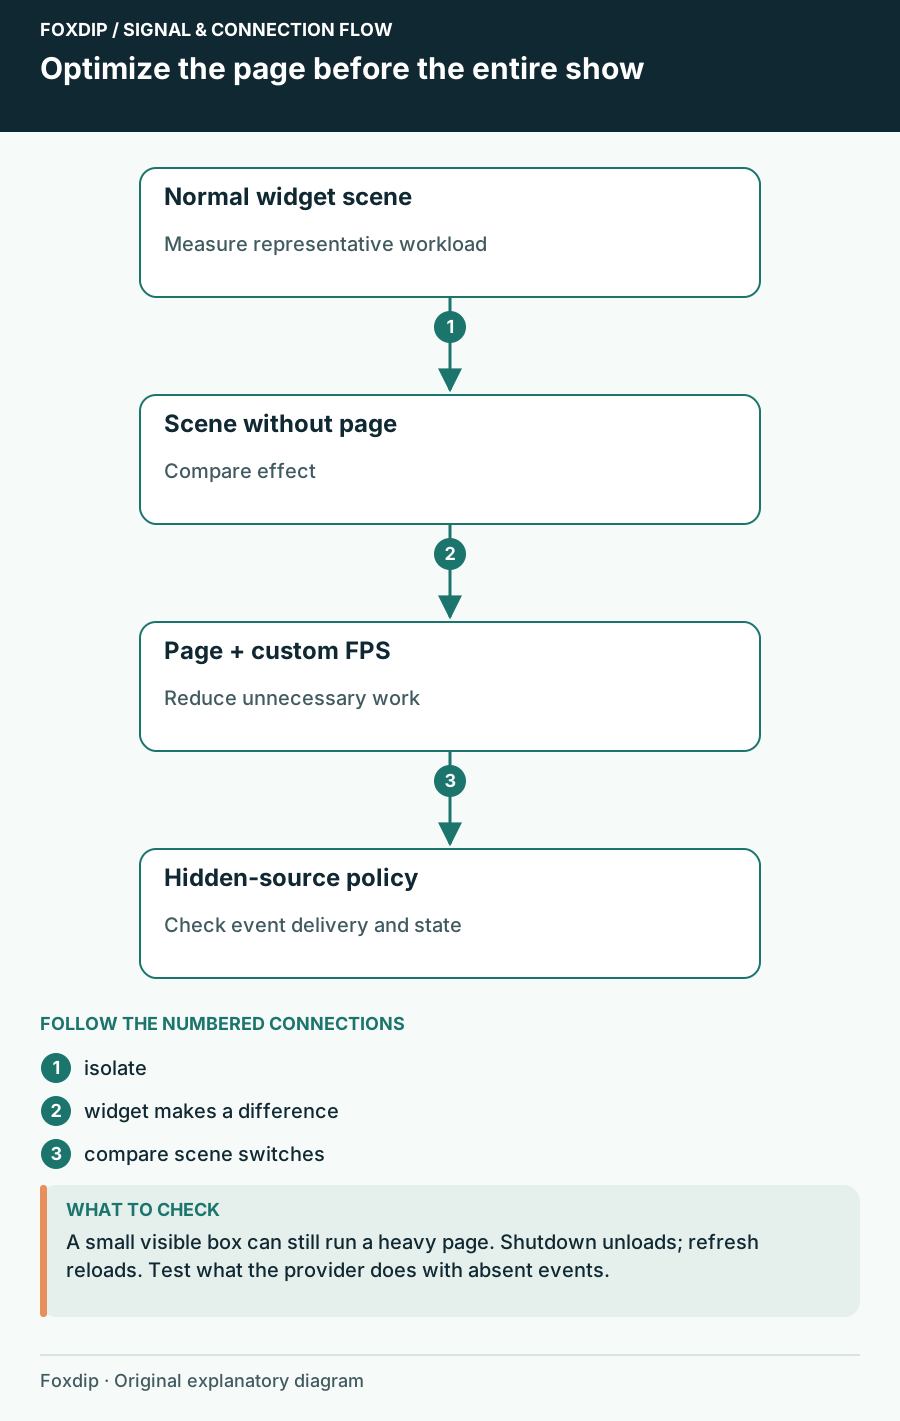
Original Foxdip schematic. Follow the labelled checks alongside the guide.
Check what the page actually contains
Open the widget’s provider editor through your normal account flow and look for duplicate layers, full-page animations, embedded video or effects that are not part of your intended layout. Remove unnecessary elements in a saved copy and compare. Keep the private widget URL out of public screenshots and logs.
A browser source is a web page running inside OBS’s embedded browser. OBS exposes viewport width and height as well as a custom frame-rate option. Match the viewport to the widget’s intended design so you do not accidentally render a much larger layout and merely crop it away afterward.
Compare frame rate with the animation you need
Lower only the widget rate
Enable its custom frame rate and compare a lower value, such as 15 fps for a slow counter or 30 fps for a modest animation. Keep the main OBS output rate unchanged.
Look for: The widget either stays acceptable with lower workload or shows visible stepping.
Choose the lowest rate that still suits this specific element; restore it if text or motion suffers.
Check an event during load
Trigger a permitted test alert while the game, camera and recording are active.
Look for: The event appears, plays its intended audio and completes its animation.
If it stutters only under full load, compare the lighter page before changing other sources.
Keep refresh out of the live troubleshooting loop
A refresh can be useful for one controlled comparison, but repeated live refreshes can interrupt alerts and make the underlying problem difficult to reproduce. Record whether the issue returns after a specific duration, scene switch or event. That pattern helps distinguish a heavy page from a state or reconnection problem.
Save the successful source settings and check the complete scene again. If CPU falls but rendering lag remains, inspect the broader scene/GPU workload. If the widget is the only remaining problem, bring its provider the exact animation, viewport, rate and trigger sequence rather than an unsupported claim that all browser sources are slow.
Use the audio checks if the lighter widget displays correctly but its sound disappears. Follow an alert’s audio route ↗
Sources & references
Based on official product documentation reviewed on 27 October 2026. Follow the recording checks below on your own setup.
- OBS — Browser Source ↗Checked 2026-10-27
- OBS — Encoding Performance Troubleshooting ↗Checked 2026-10-27
Spotted something out of date? Let Alex know.
How we put our guides together ↗